Unlike Apple iOS, Since Android is an Open Source, It is free for regular users. Companies like Samsung and Xiaomi have to pay for the Android OS usage, and they constantly modify it with their custom skin UI. Since Google didn’t control the other companies’ OTA updates, the Android OS roadmap updates may delay based on the manufacturers. The delay can be high when using a custom skin UI other than the Stock Android version. Google already rolled out Android 12 last year. But still, most of the mobile companies are on Older versions. But, As per the Distribution report, Android 11 will be the most popular OS among users until March 2022. It is not wrong that the One version down OS is popular. But, Still, companies are slow in rolling out updates.

Google stopped providing Distribution Report Monthly
In the past, Google freely offered this information online as an often updated pie chart that assigned the percentage for every variation of Android. However, this information did not work for Google and was used to counter Apple’s quicker adoption rate in the new version of iOS. The chart was not regularly updated and eventually not available.

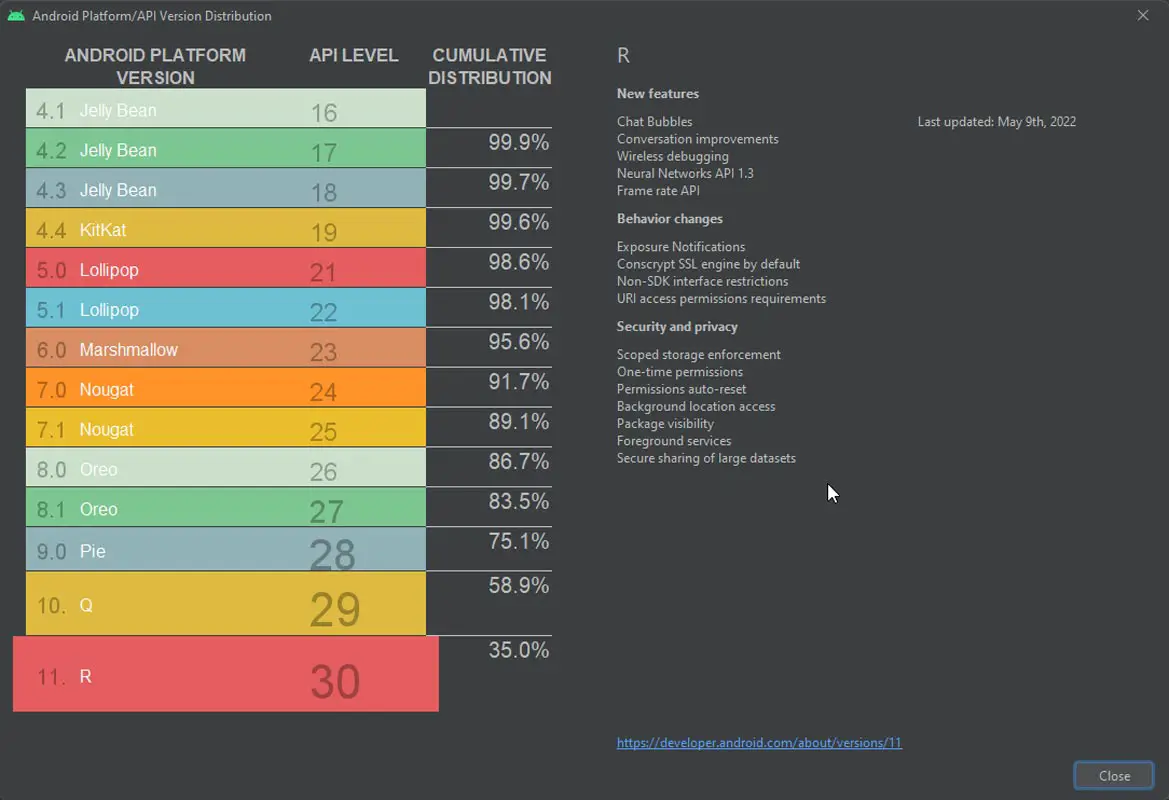
Recently, Google has taken a different approach with their Android distribution graph by integrating the data inside Android Studio to show the percentage of devices using a specific version or later. The Android Studio chart is regularly updated every six months for a year and the previous version coming in November and a new version launching on the 9th of May.
Android 11 is the popular OS- According to the March 2022’s Distribution Report

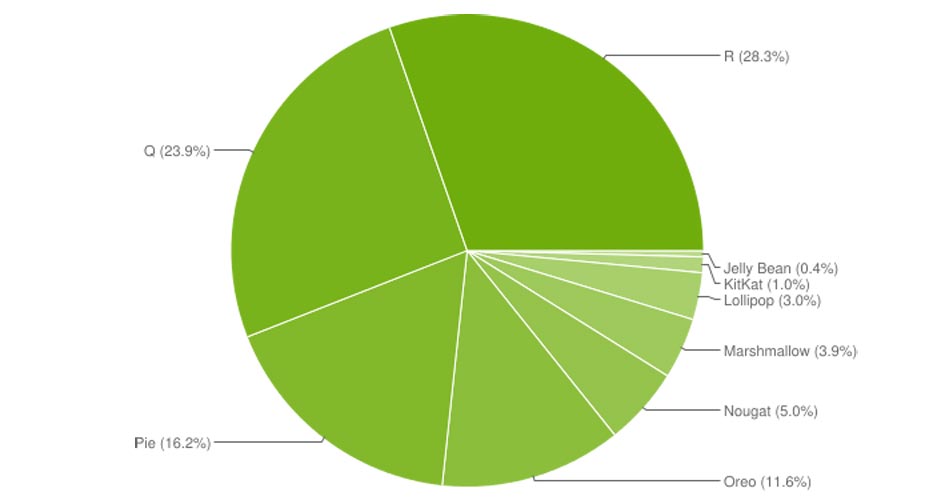
Android 11 now has a leading share of 28.3 percent, up by 4 percent over last year. The last time that the charts were updated in November to November 2021. It was a time when the latest version, which is the most popular version, was rare, and, with the help of the Android OEMs stepping up their game when it comes to updating, notably Samsung, it’s a lot better in the present. In the meantime, the percentage that Android 10 has of Android 10 has gone down to 23.9 percent from 26.5 percent, with earlier versions of Android having similar decreases in use.
Why is there an absence of Android 12 in the chart?
This lack of Android 12 on this chart could be related to the intention behind the chart and not be the reason for low adoption. According to 9to5Google, the chart’s purpose is to aid developers in choosing the best Android version they should be able to. App updates and new apps must currently be compatible with Android 11 (API level 30) or greater; however, the minimum Android version support depends on the developer’s determination. The data should, at a minimum, provide a picture of the potential user base that developers be able to access.
Utilizing this chart, app developers can determine the percentage of potential customers they could lose due to not supporting the old Android version. In this regard, the number of users using Android 12 or 12L isn’t relevant. But, the data could be interesting to study, mainly because We could separate the information about Android 12 and Android 12L because they have various APIs.
Wrap Up
The distribution chart report may not be valid for regular users. But, You can understand why Google can’t achieve the OTA updates flow because of the other mobile companies. OTA updates are essential in terms of maintaining security on your mobile. So, It is wise to get a mobile that follows the regular OTA updates. The OTA updates cycle is not only dependent on the manufacturers. Users also directly participate in the decisions. That’s why some companies didn’t roll out security patches regularly. What are your thoughts about Android OS March 2022 Distribution Report? Share it below.

Selva Ganesh is the Chief Editor of this Blog. He is a Computer Science Engineer, An experienced Android Developer, Professional Blogger with 8+ years in the field. He completed courses about Google News Initiative. He runs Android Infotech which offers Problem Solving Articles around the globe.


Leave a Reply